Population Lines - the Tableau Edition

Population Lines – the Tableau Edition

In 2013 Dr. James Cheshire from the Centre for Advanced Spatial Analysis at the University College London created a data visualization that was critically acclaimed back then and saw something of a renaissance a few weeks ago when a modified version by Henrik Lindberg made its way onto the Reddit front page. I had been mesmerized by the viz from the beginning, so when it reappeared in my blog reader I decided I had to try reproducing it in Tableau.

Continue reading →

LEGO-ify Tableau

A number of colleagues, customers, people visiting any of my public presentations and even friends have asked in the recent past about my Windows desktop wallpaper and where to get it.

LEGO-ified Tableau logo

LEGO-ified Tableau logo

The first question I get most of the time is: “Is it real?” Well, no. Unfortunately it’s not. I’d love to have enough time to build something that awesome in real LEGO bricks, though!

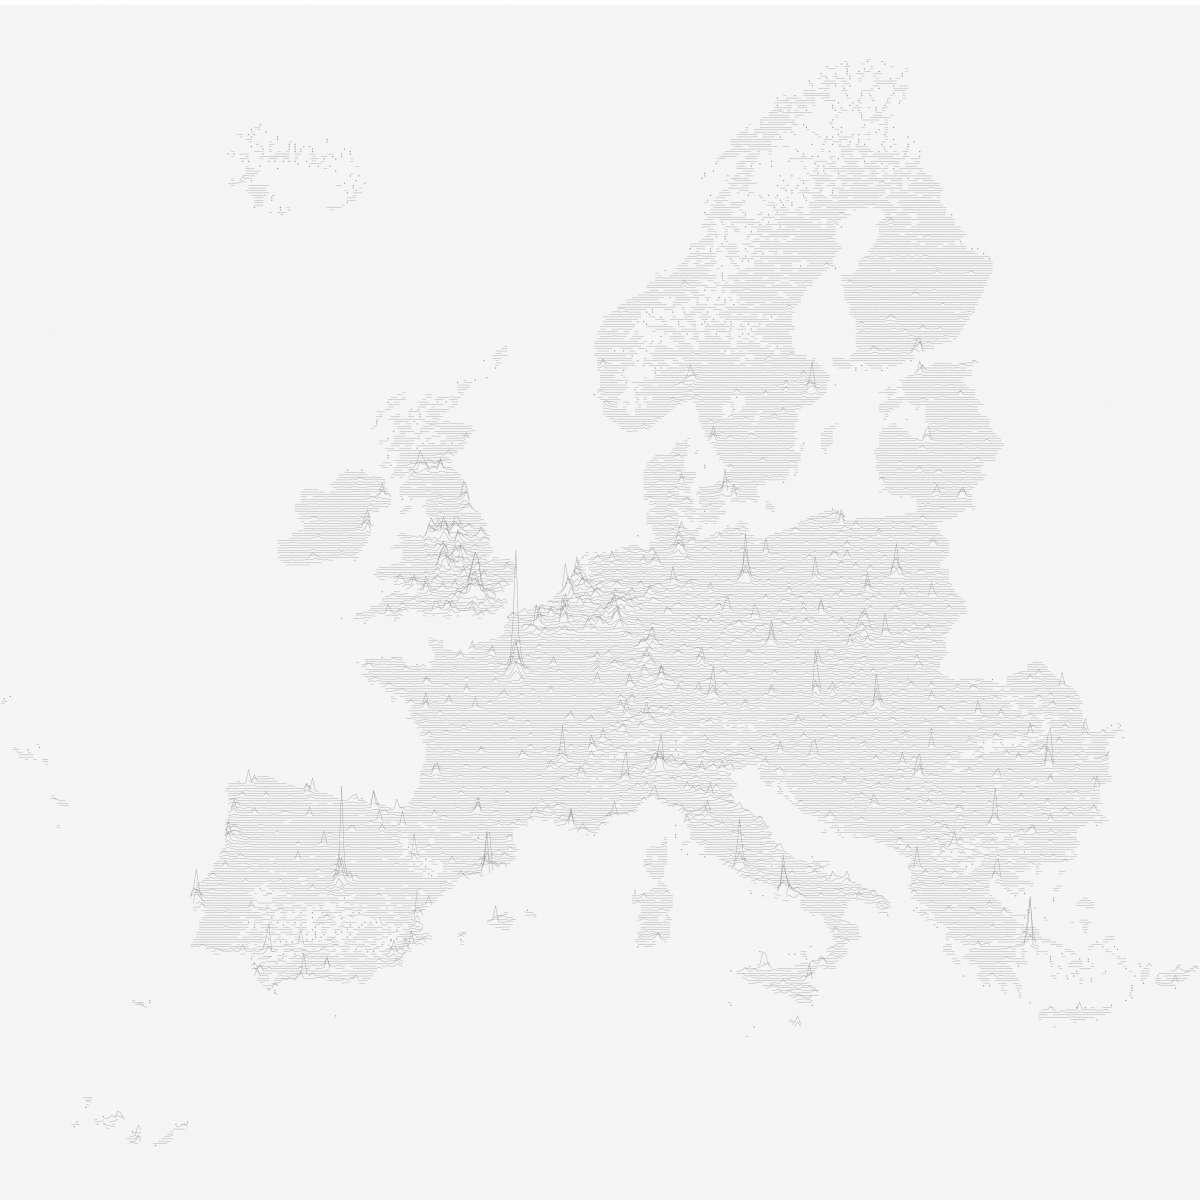
So, if it’s not real, then how was it done? As is often the case with me I got the inspiration from one of the many blogs I read on a regular basis. In this case it was an article by John Nelson over on his blog Adventures in Mapping. There he showed an easy-to-follow way to LEGO-ify maps and satellite images. And I did exactly the same, just with an image of the lovely Tableau logo (Tableaugo? … maybe not) after scaling it to a Full HD resolution of 1920 x 1080 pixels and filling the empty space with white bricks pixels. Credit where credit is due, so I won’t nastily copy & paste the how-to here but instead redirect you to John’s writings. In the meantime John and Vanni Zhang, another map and LEGO geek, even whipped up an interactive website that allows you to automagically generate LEGO-ified maps from web maps.

Give it a try, enjoy the LEGO style and take care not to break any virtual fingernails with those pesky 1×1 bricks… Also, show us what LEGO-goodness you came up with! Oh, and feel free to download my TabLEGau wallpaper. When sharing I’d be happy if you told people where you got it from.

The last available report per BookID is marked

Reporting Self-Updating Data Using Wildcard Union in Tableau

Imagine you have some kind of system that produces reports on your data – for this example I randomly decided to use bookings for events -, and these reports are published on a regular schedule. Now you want to see two things in your report:

  1. The current status of participants per event – both for past events (i.e. the actual number of participants) and for future events (i.e. the current number of people registered).
  2. An overview of how the number of people registered changed over time.

Also, your source system is publishing these data as .csv files. How can this be done?

Well, very easily using the new wildcard union feature introduced in Tableau Desktop 10.1! Read on to see how this can be done.

Continue reading →

Tatort (Quelle: ARD / daserste.de)

Hinter den Kulissen der Tableau Kino Tour – Teil 3: Die Tatorte

Nachdem ich in den beiden vergangenen Teilen dieser Serie gezeigt hatte, wie wir die IMDb-Daten (Teil 1) bzw. die Daten zu Filmreihen (Teil 2) extrahiert und in ein brauchbares Format überführt haben, möchte ich nun noch beleuchten, wie wir die Daten zur Analyse der Krimireihe “Tatort” gewonnen und bearbeitet haben. Für den “Tatort” als Untersuchungsobjekt haben wir uns entschieden, da es dazu Unmengen an Daten gibt (s.u.), da sich die Serie von verschiedenen Aspekten her analysieren lässt (die Serie wird seit vielen Jahrzehnten produziert, findet an unterschiedlichen geographischen Orten statt, involviert eine Menge an Ermittlern, Schauspielern, usw.), und da es eine der, wenn nicht sogar die beliebteste deutsche Fernsehserie ist. Und auch, weil ich selbst ein großer Fan bin und mich das Thema und die Daten auch ganz persönlich interessiert haben…

Continue reading →

Tableau: Ist der erste Film immer der erfolgreichste?

Hinter den Kulissen der Tableau Kino Tour – Teil 2: Die Filmreihen

Dies ist der zweite Teil in einer dreiteiligen Serie zu den technischen Hintergründen der Tableau Kino Tour. Teil 1 beschäftigt sich mit dem Auslesen und Nutzbarmachen der IMDb-Daten, hier geht es um Filmreihen, der dritte Teil wird sich mit den Daten zum “Tatort” beschäftigen.

In den letzten Jahren wurde es unter Filmstudios und Produzenten immer populärer, einen oder meist gleich noch mehrere Teile nachzuschieben, sobald ein Film erfolgreich war. Neudeutsch spricht man dann von einem Franchise – um nicht zu sehr in Anglizismen zu verfallen sprechen wir im Kontext der Tableau Kino Tour lieber von Filmreihen. Die Idee ist ja an sich auch nichts neues, mehrteilige Filme oder Fortsetzungen gibt es schon sehr lange. Man denke nur an “Star Wars”: Der erste Film 1977 wurde noch als einzelnes Werk konzipiert, dann wurden nach dem großen Erfolg zwei weitere Teile produziert, 16 Jahre später nochmals drei Teile, und dann wiederum 10 Jahre später nochmals drei Teile – wovon bisher allerdings erst einer tatsächlich veröffentlicht wurde, auf die restlichen beiden müssen wir uns noch ein wenig gedulden.

Continue reading →