Visuelle Datenanalyse macht Sinn

Schon wieder ist mehr als ein Jahr vergangen, in dem dieses Blog mehr oder weniger komplett brach lag. Und in der Zwischenzeit ist so viel passiert!

Im Rahmen meines Jobs beim Institut für Verkehrsforschung am Deutschen Zentrum für Luft- und Raumfahrt (DLR) in Berlin habe ich nicht nur an der theoretischen und praktischen (Weiter-)Entwicklung von großmaßstäblichen Verkehrsnachfragemodellen gearbeitet, sondern habe daneben natürlich auch die daraus und auch aus anderen Projekten resultierenden Erkenntnisse (mit-)publiziert. Bei dieser Forschung habe ich hauptächlich mit R, Shiny, PostgreSQL/PostGIS, QGIS und vereinzelt ein paar Zeilen Python gearbeitet. Und ich liebe sie alle, wann immer ich mit ihnen arbeiten darf. Aber ich fand es zunehmend schwierig und anstrengend, Daten einfach, schnell, und trotzdem optisch ansprechend zu visualisieren. Natürlich lassen sich mit R und ggplot druckreife Plots erstellen, und Shiny und Leaflet erlauben die Generierung von interaktiven Grafiken und Karten. Aber manchmal ist es einfach nicht zielführend, sich mit den Feinheiten der jeweiligen Einstellungen und dem Schreiben des notwendigen Codes zu beschäftigen. Ich empfand es insbesondere in der höchst spannenden Phase der explorativen Datenanalyse (quasi dem ersten Date mit neuen Daten im Rahmen des Analyseprozesses…) als sehr störend, dass ich mich so viel mit Code und anderen technischen Aspekten beschäftigen musste, was mich von der eigentlichen Arbeit mit den Daten abgelenkt hat, nämlich dem Verstehen der Daten. Um nochmals die Dating-Analogie zu bemühen wäre das so, als würde man sich mehr damit beschäftigen, was man zum Essen bestellt oder worüber der nächste Small-Talk gehen soll, als sich mit dem (Gesprächs-)Partner zu beschäftigen und sich nur auf ihn/sie zu fokussieren. Wahrlich kein Erfolgsrezept… Continue reading →

Why Visual Data Analysis is Great

Wow, another year has passed and so much has happened in the meantime!

During my job at the Institute for Transport Research at the German Aerospace Center (DLR) in Berlin I not only worked on the theoretical underpinnings and actual development and implementation of micro-scale traffic models but was obviously also involved in publicizing the results of said models and also other research work. I did this mostly with R, Shiny, PostgreSQL/PostGIS, QGIS and the occasional line of Python code sprinkled in-between. They’re all great. I love them with all my heart and enjoy every second I’m working with one of them. But I found it increasingly hard to visualize data easily and quickly while still being pretty. Sure R and ggplot allow for camera-ready plots, Shiny and Leaflet make it increasingly easy to put together interactive plots and maps. But sometimes fiddling with their settings and writing the necessary code is just not practical to get to the point quickly. Also, during the fascinating stage of exploratory data analysis (kind of the first date with your new data in the data analysis process…) I felt focusing too much on the code and other technical aspects which distracted me from what I was originally doing: exploring my data to get a better understanding. Going back to the dating analogy it’s like over-thinking what to order and what small-talk topic to bring up next and thereby losing the interest of your possible future partner instead of being focused exclusively on him/her. Not a recipe for success… Continue reading →

Annoying join behavior in QGIS

Today I stumbled across something I wouldn’t exactly consider a bug, but at least some rather unintuitive and annoying behavior in QGIS when performing table joins.

I did something very mundane: joining a Postgres table of spatial data to another Postgres table of attribute data. The normal way to do this (for me) is as follows:

  1. Open the spatial table using Layer > Add Layer > Add PostGIS Layers...
  2. Open the attribute table the same way (1 & 2 can be loaded in one go)
  3. Join the tables in the spatial table’s Properties dialog.

For that last step I decided to join the two tables (plr is the spatial table here, while mss has the attributes) using the field plr_id, which exists in both tables and only once on each side (hence a plain vanilla 1:1 join).

Add vector join dialog window in QGIS 2.8

Add vector join dialog window in QGIS 2.8

That works perfectly fine, except that somehow the order of the joined fields appears to get messed up:

QGIS attirbute table with erroneously shifted field contents

QGIS attirbute table with erroneously shifted field contents

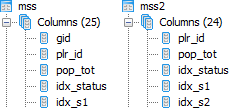
Some research revealed that this seems to be a problem caused by identical field names in the two joined tables other than the join field itself. In my case the aforementioned plr_id was used to join the two tables, but in addition both tables also had a field gid, as can be seen in the following screenshot on the left:

Table design in pgAdmin: original table including field gid on the left, fixed table without (unnecessesary) field gid on the right

Table design in pgAdmin: original table including field gid on the left, fixed table without (unnecessesary) field gid on the right

Removing this field gid from the attribute table mss was no problem, since the 1:1 relation to the spatial data uses the key plr_id anyways. As can be seen in the screenshot above on the right, the new table mss2 is identical to mss, only without the field gid. And lo-and-behold – joining this attribute table to the spatial table plr in QGIS works flawlessly now:

QGIS attirbute table with correct field contents

QGIS attirbute table with correct field contents

This problem had already been identified in QGIS 2.0 in late 2013, and has been marked as fixed in the meantime. Removing fields with identical names in the two tables is one – admittedly rather radical way – to solve circumvent the issue. Another, more intuitive way would be to choose a meaningful table prefix in the Add vector join dialog which can be seen in the first image above. As you can see I checked the Custom field name prefix checkbox but left the field empty. I prefer this, since it keeps my field names nice and tidy, but in cases where homonymous fields exist in the two tables you will run into trouble – hence entering a prefix here would be a nice and easy fix for this issue.

Everything described above was performed on QGIS 2.8.1-Wien (64bit) on a Windows 7 machine and PostgreSQL 9.1.16 on a 64bit Ubuntu 4.6.3 server (PostGIS 1.5.3).

The Power of Vectorization in R

I have always been a great fan and avid user of databases. They’re just so versatile, efficient, easy to use, … I found this to be true for all kinds of data, small and large, high-dimensional and low-dimensional, spatial, temporal, you name it. It was only very recently that my data seemed to have outgrown my PostgreSQL database. Not so much in size, but rather in performance.

Continue reading →

Creating Multiple Concentric Ring Buffers in PostGIS

Whenever possible I recently try to get all my GIS work done in QGIS. Most of the time this is no problem at all. Sometimes it makes things even easier, such as when you’re trying to work with your geospatial data in a PostgreSQL/PostGIS database (good luck trying that in ArcGIS!). But sometimes you come across a task that is just so exotic that nobody has ever come across it. Or at least nobody wrote about coming across it…

Continue reading →