It’s been awfully quiet here on the blog recently. This is owed to some major changes in my life, including the successful end of my PhD program, a successful job hunt, a move from Japan to Germany, and an interesting yet challenging start in my new job at a major German research institute.
But the recent release of MacOS 10.10 “Yosemite” together with the even more recent release of the new QGIS 2.6 “Brighton” was a brilliant opportunity to not only bring back some life here, but also to continue my mini-series of articles about installing and running QGIS and other rather scientific software packages on the latest versions of MacOS (see here, here, and here for example).
So I sat down on my freshly delivered sofa between unpacked boxes to try my luck. To make a long story short, in my case the installation ran smoothly and was done in about half an hour – downloading the necessary disk images took most of time. But before I updated my QGIS 2.4 to the new version 2.6 I first tried if 2.4 still runs on my freshly upgraded MacOS Yosemite. And there was a small surprise waiting for me here, as MacOS asked me to update my Java SE 6 runtime!

Updated Java SE 6 runtime necessary
Luckily this was no big deal, since the error message provided a link to the download page at Apple.
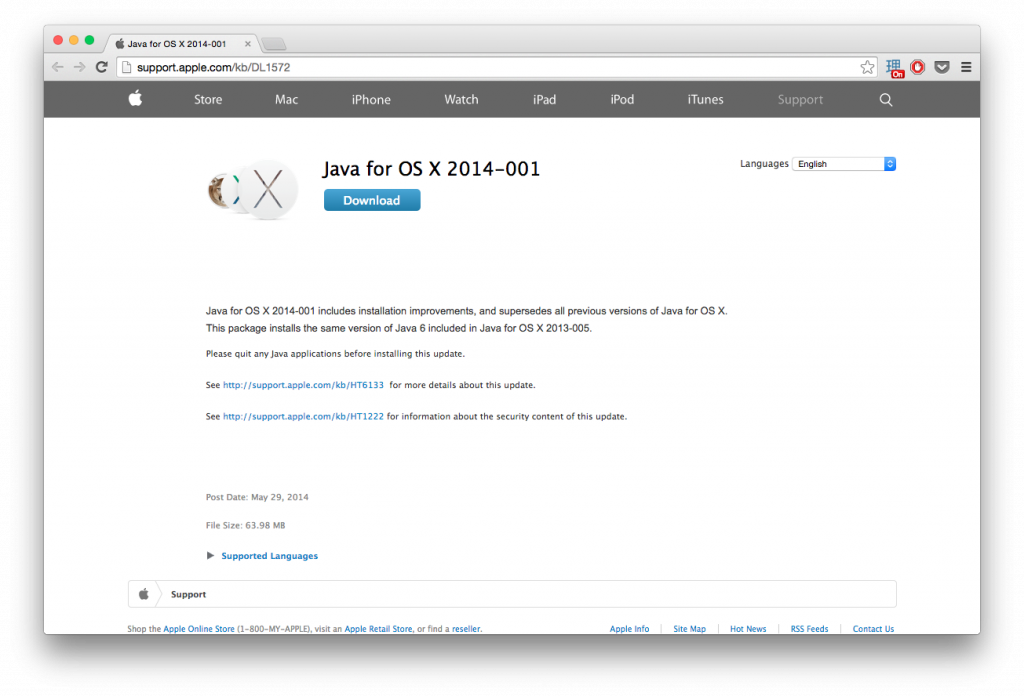
Apple provides the Java update

Easy installation of the Java update
After running this update QGIS 2.4 worked fine like before.
For the download of QGIS itself I decided once again for the packages provided by William Kyngesburye a.k.a KyngChaos – not only did I never have any problems with these, but to my best knowledge they are the only available pre-compiled QGIS packages for MacOS… The installation process follows the steps known from earlier releases:
1. GDAL
First is the new GDAL 1.11. The installation is as easy as downloading the DMG and installing GDAL from the respective PKG therein. Please ignore the NumPy package also contained in the GDAL disk image, since it’s an outdated version. Oh ya, and then there’s this thing that’s still annoying me:
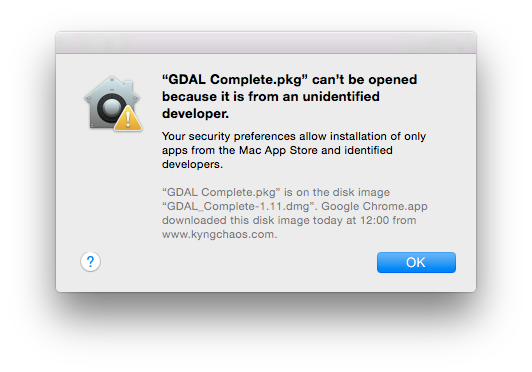
That’s still annoying
Gatekeeper refuses to open applications and packages from “unidentified developers” (that is, developers that can’t afford a certificate by Apple) by double-clicking. Hence you need to right-click it and select Open.
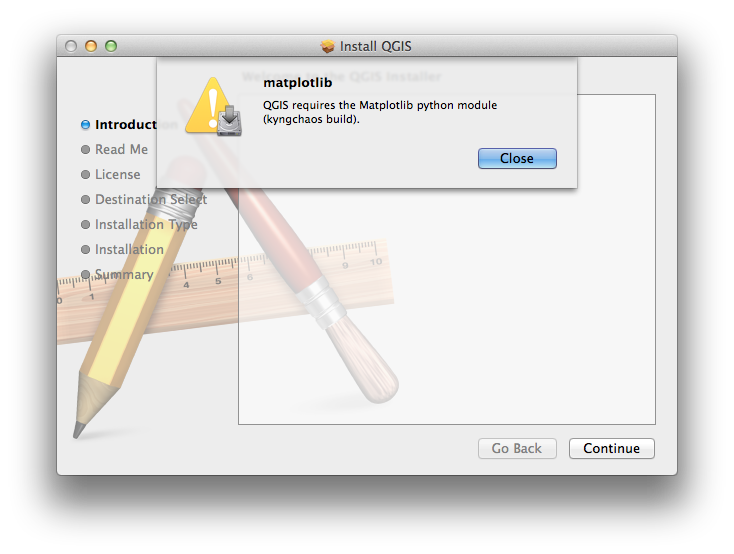
2. matplotlib and NumPy
Before we can install matplotlib we need to install NumPy. There you can find the most recent version 1.8.0-1. As is stated on the website NumPy is “included on the GDAL Framework disk image, though it may not be up to date”. And indeed the GDAL image mentioned above includes NumPy 1.6.2-1 from mid-2012…
Now that that’s out of the way we can install matplotlib 1.3.1-2.
3. QGIS
And finally QGIS 2.6.0-1 itself. As in the other cases we open the DMG file and install from the PKG file therein. That’s it!

QGIS 2.6 “Brighton” splash screen

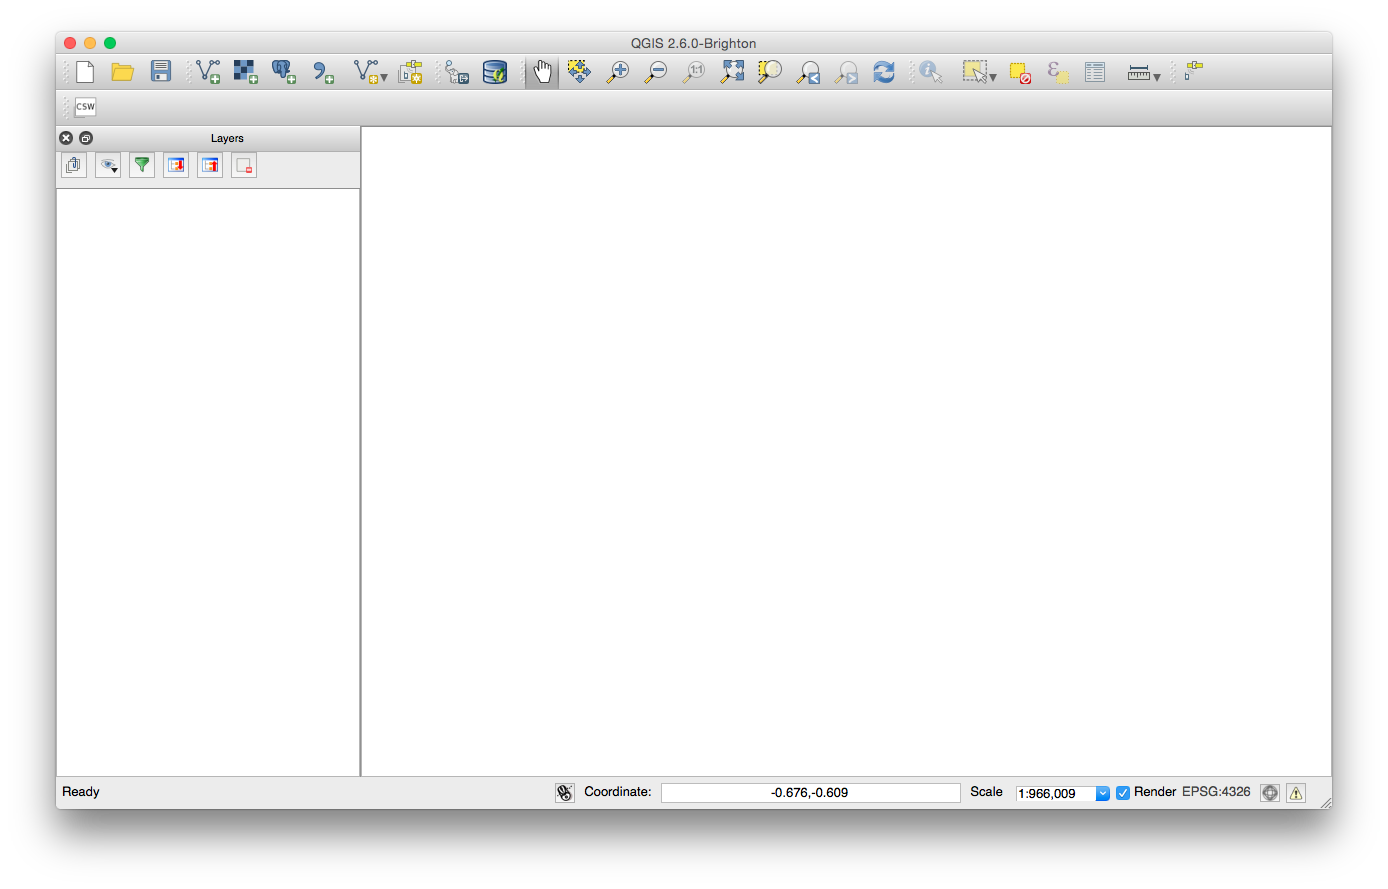
QGIS 2.6 “Brighton” UI on Yosemite
Now that everything was installed it was time to fire it up for the first time. And lo and behold, it works! Just like that. You can’t ask for more. Now it’s time to discover all the great new features QGIS 2.6 brings!