In the introduction to the UN HABITAT report State of the World’s Cities 2012/2013: Prosperity of Cities it is written:
“As the world moves into the urban age, the dynamism and intense vitality of cities become even more prominent. A fresh future is taking shape, with urban areas around the world becoming not just the dominant form of habitat for humankind, but also the engine-rooms of human development as a whole. This ongoing evolution can be seen as yet another assertion, albeit on a larger scale, of the time-honoured role of cities as centres of prosperity. In the 21st as in much earlier centuries, people congregate in cities to realize aspirations and dreams, fulfil needs and turn ideas into realities.”
(United Nations 2012, v)
I could not agree more, and this is one of the reasons that I was captivated by cities from an early age, long before I started my academic career – or even had an idea of what an academic career is, for that matter. Cities interest me, cities fascinate me, and cities defined me. Having lived in Munich, Frankfurt, and Tokyo, and having visited many other amazing specimen worldwide has definitely had an impact on me and taught me many things. Studying cities is never boring and continues to surprise and astonish me on a regular basis.
A while ago I got my hands on an amazing data set: the address points (座標付き電話帳データベース テレポイント®Pack!) by ZENRIN Co., Ltd. (株式会社ゼンリン). It can be seen as a geocoded phonebook-cum-yellow-pages with some added information. According to the (scarce) documentation and description it is a product of three data sets:
- The address master (住所マスタ) by the Japan Geographic Data Center (国土地理協会),
- resident data (Zmap TownII居住者データ) by ZENRIN Co., Ltd. (株式会社ゼンリン), and
- telephone data (テレデータ) by Daikei Data Processing Co., Ltd(ダイケイ株式会社), which itself consists of the phone book (ハローページ) and yellow pages (タウンページ) data sets by NTT Directory Services Co., Ltd. (NTTタウンページ株式会社).
I was lucky enough to get access to the complete data set for the Tokyo Metropolitan Area (東京都) in the course of a research project in cooperation with the Center for Spatial Information Science (空間情報科学研究センター) at the University of Tokyo (東京大学) within the scope of joint research No. 405 (共同研究 No. 405).
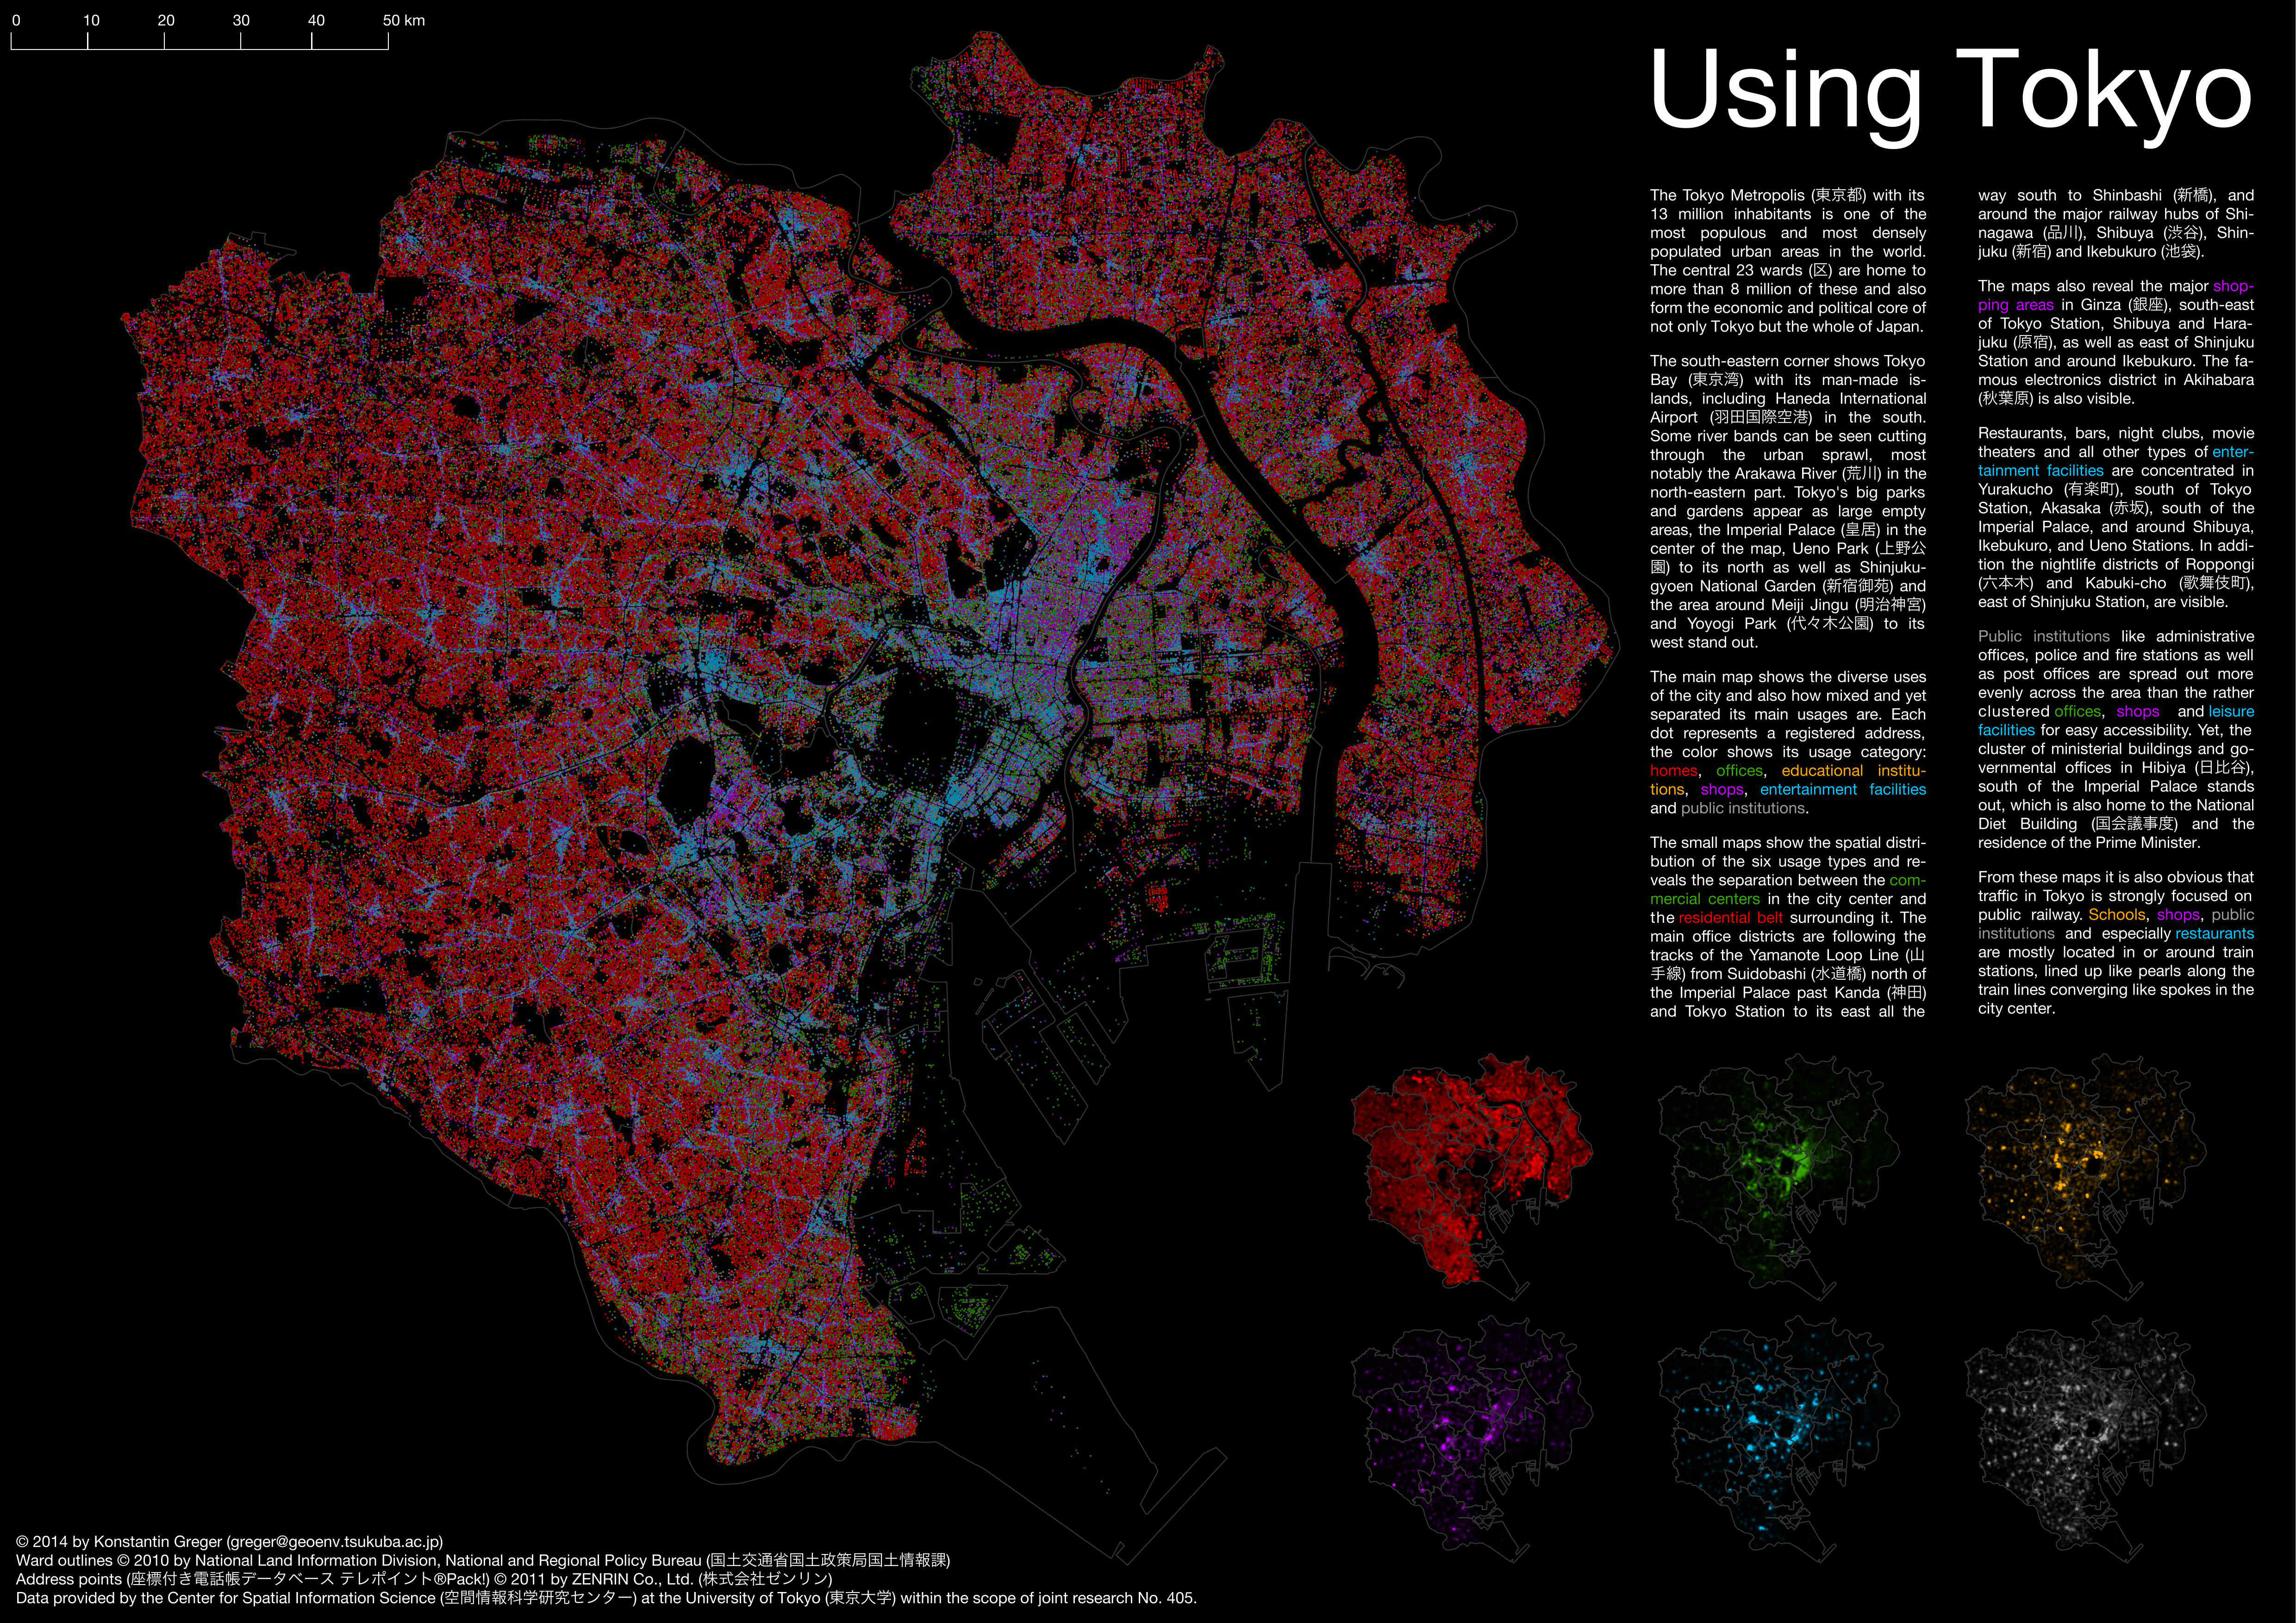
In total the data for the 23 Special Wards of Tokyo (東京都23区) contains information about 6,280,550 address points, 67% of them being residential addresses with the remainder being commercial addresses. Based on the data set’s attributes I classified these data into six usage categories: homes, offices, educational institutions, shops, entertainment facilities, and public institutions. One of the first step of any data analysis process for me is to visualize the data, so that’s exactly what I did: I put it all on a map. The result was more or less what you can see below. Admittedly, I invested a little bit of time to make it look prettier, but there were no more computational steps involved. The map itself was created in QGIS 2.0 with a simple point symbology, categorized by color and assigned 33% transparency.
Using Tokyo
While the map is without a question quite beautiful in itself, I especially like the fact that it consists of only one dataset (plus the ward outlines for reference) and yet tells so many different stories at the same time. It becomes immediately obvious that while all six usage categories are spread out throughout the area shown they are not distributed equally and instead reveal several patterns.
A suburban residential belt can be seen spreading from just outside the tracks of the Yamanote Line (山手線) loop. In contrast, the center-most area is dominated by business and office usage, starting roughly near Iidabashi Station (飯田橋駅) north of the Imperial Palace (皇居) grounds and stretched alongside the Yamanote Line tracks until Shinagawa Station (品川駅) and from the eastern side of Tokyo Station (東京駅) northwards until Ueno Station (上野駅). The business areas along the coast of Tokyo Bay (東京湾) are dominated by logistics and cargo companies and their warehouses. The largest shopping areas can be identified in the northeast of Shibuya Station (渋谷駅), where the upscale Omotesandō Street (表参道) and the rather alternative Harajuku (原宿) quarters are located, as well as in the Ginza neighborhood, south of Tokyo Station, and around Akihabara Station (秋葉原駅), which is dominated by electronics and duty-free shops. The infamous entertainment quarters of Kabuki-chō (歌舞伎町), northeast of Shinjuku Station (新宿駅), as well as in Shibuya (渋谷) and Roppongi (六本木) can easily be seen. In addition, small clumps of restaurants and other entertainment facilities such as bars and karaoke parlors in the immediate vicinity of practically all train stations show the importance these transportation hubs have in the day-to-day lives of the Tokyoites. Similarly, agglomerations of education institutions near train stations, which at closer look turn out to be language and cram schools, looking for the most convenient locations to attract customers.
A closer look at the area inside the loop of the Yamanote Line tracks reveals some residential clusters on the small artificial island of Tsukishima (月島) southeast of Tokyo Station and in south-western Minato ward (港区), northwest of Shinagawa Station (品川駅). The agglomeration of offices to the west and to the east of Shinjuku Station are also visible. Additional clusters of leisure facilities can be seen in Ameya-yokochō (アメヤ横丁) south of Ueno (上野), in Yūrakuchō (有楽町) and Akasaka (赤坂), south of Hibiya Park (日比谷公園), around Ebisu Station (恵比寿駅) and Gotanda Station (五反田駅) between Shibuya and Shinagawa on the Yamanote Line, as well as in Kinshichō (錦糸町) and Nakano (中野) on the eastern and western edges of the map, respectively.
One of the most interesting discoveries for me when I first looked at this map was the fact that objects that aren’t even drawn on the map show up very clearly. One example are the train stations, which stand out clearly by the agglomerations of certain features as I mentioned before. Yet the most striking objects are certainly the negative spaces formed by parks, such as the Imperial Palace, Shinjuku-gyōen National Garden (新宿行園), Yoyogi Park (代々木公園), and Ueno Park (上野公園), but also by the numerous rivers and canals that transect and structure the city, such as the Arakawa (荒川) in the northeastern part.
At a closer look areas particularly famous for their high density of high rise buildings, such as the Marunouchi/Otemachi (丸の内・大手町) neighborhood west of Tokyo Station and the office district west of Shinjuku Station, also appear rather empty. This turns out to be a result of the high vertical integration occurring in these areas, where all address points for one high rise tower converge in one point, overlaying each other, obfuscating their actual number.
The smaller maps in the lower right corner of the main map ameliorate this last effect, as these are density maps of the address points of each of the six usage categories. Here especially the two aforementioned areas (Marunouchi/Otemachi and western Shinjuku) stand out with their high density of office locations, overpowering most of the remaining city. Similarly the accumulation of education institutions, entertainment facilities and public institutions around the train stations can be seen easily. There are many more discoveries to be made from all seven maps and especially by comparing them with each other, but I will leave these up to the inclined reader and explorer. (Feel free to mention them in the comments if you like!)
Overall this visualization provides a very good impression of how space in Tokyo’s city core is being used, how its inhabitants and users are shaping this “habitat for humankind”, as the report I started with called it (United Nations 2012, v). It is my aspiration and dream to understand myself and help others understand better what is going on in cities, what constitutes and shapes them, and how they in turn shape us humans. I therefore hope that this visualization can provide a few insights into how people are using Tokyo. If not I hope that you may find it at least as pretty as I do. If you like it, you don’t have to stick with the JPG image above, instead feel free to download a high-resolution A3 PDF. Be warned though that it weighs in quite heavy at 195 MB!
References
United Nations. 2012. State of the World’s Cities 2012-2013: Prosperity of Cities. [S.l.]: United Nations Publications.