In a recent blog post I showed how easy it is to create maps in Tableau showing paths, basically lines connecting two points each: the start and end locations. Those can be departure and arrival airports of certain flight routes, origin and destination of refugee flows, source and sink of money transfers, … the possibilities are endless!
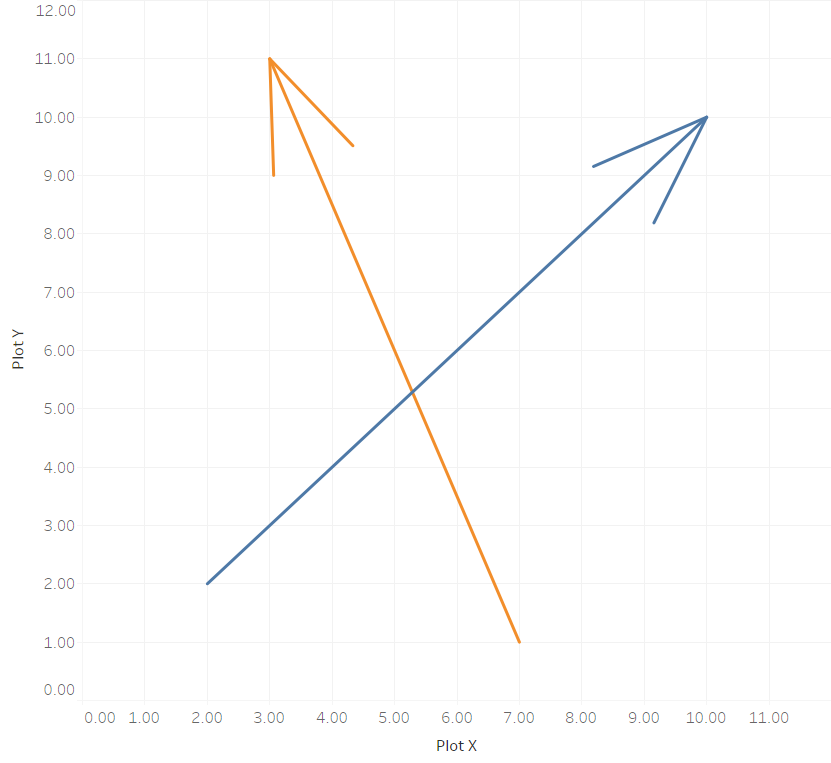
But now imagine a map with a line connecting two locations A and B. Or rather many such lines. What information does this hold for you? What insights can you get out of such a viz? There is one very important element still missing! That is: which direction is this connection? Sure, there are cases where direction doesn’t matter, but thinking of the three aforementioned example use cases, many times it does! So let’s give our connecting paths some directionality. Let’s take simple lines and make them arrows!