Imagine you have some kind of system that produces reports on your data – for this example I randomly decided to use bookings for events -, and these reports are published on a regular schedule. Now you want to see two things in your report:
- The current status of participants per event – both for past events (i.e. the actual number of participants) and for future events (i.e. the current number of people registered).
- An overview of how the number of people registered changed over time.
Also, your source system is publishing these data as .csv files. How can this be done?
Well, very easily using the new wildcard union feature introduced in Tableau Desktop 10.1! Read on to see how this can be done.
For the purpose of demonstration I’m using very simple dummy data here, which is reduced to just the fields necessary to show what we’re doing here. This is how my first report looks like:
StartDate,BookID,Participants
4/10/2017,A,10
4/10/2017,B,10
5/1/2017,C,10
So we have three fields: StartDate, which has the actual date the event is happening (or has happened in the past); BookID, which is a unique identifier for each single event; and Participants, which has the number of people assigned to this event at the time the report was created. The names of the report files themselves is also important: here I chose report-20170419.csv. The actual name ist not really that important, but it has to contain the creation date in one form or another (here 20170419 for April 19, 2017. I also created two more dummy files – all three (and the final workbook we’re building in this blog post) can be found on my GitHub repository.
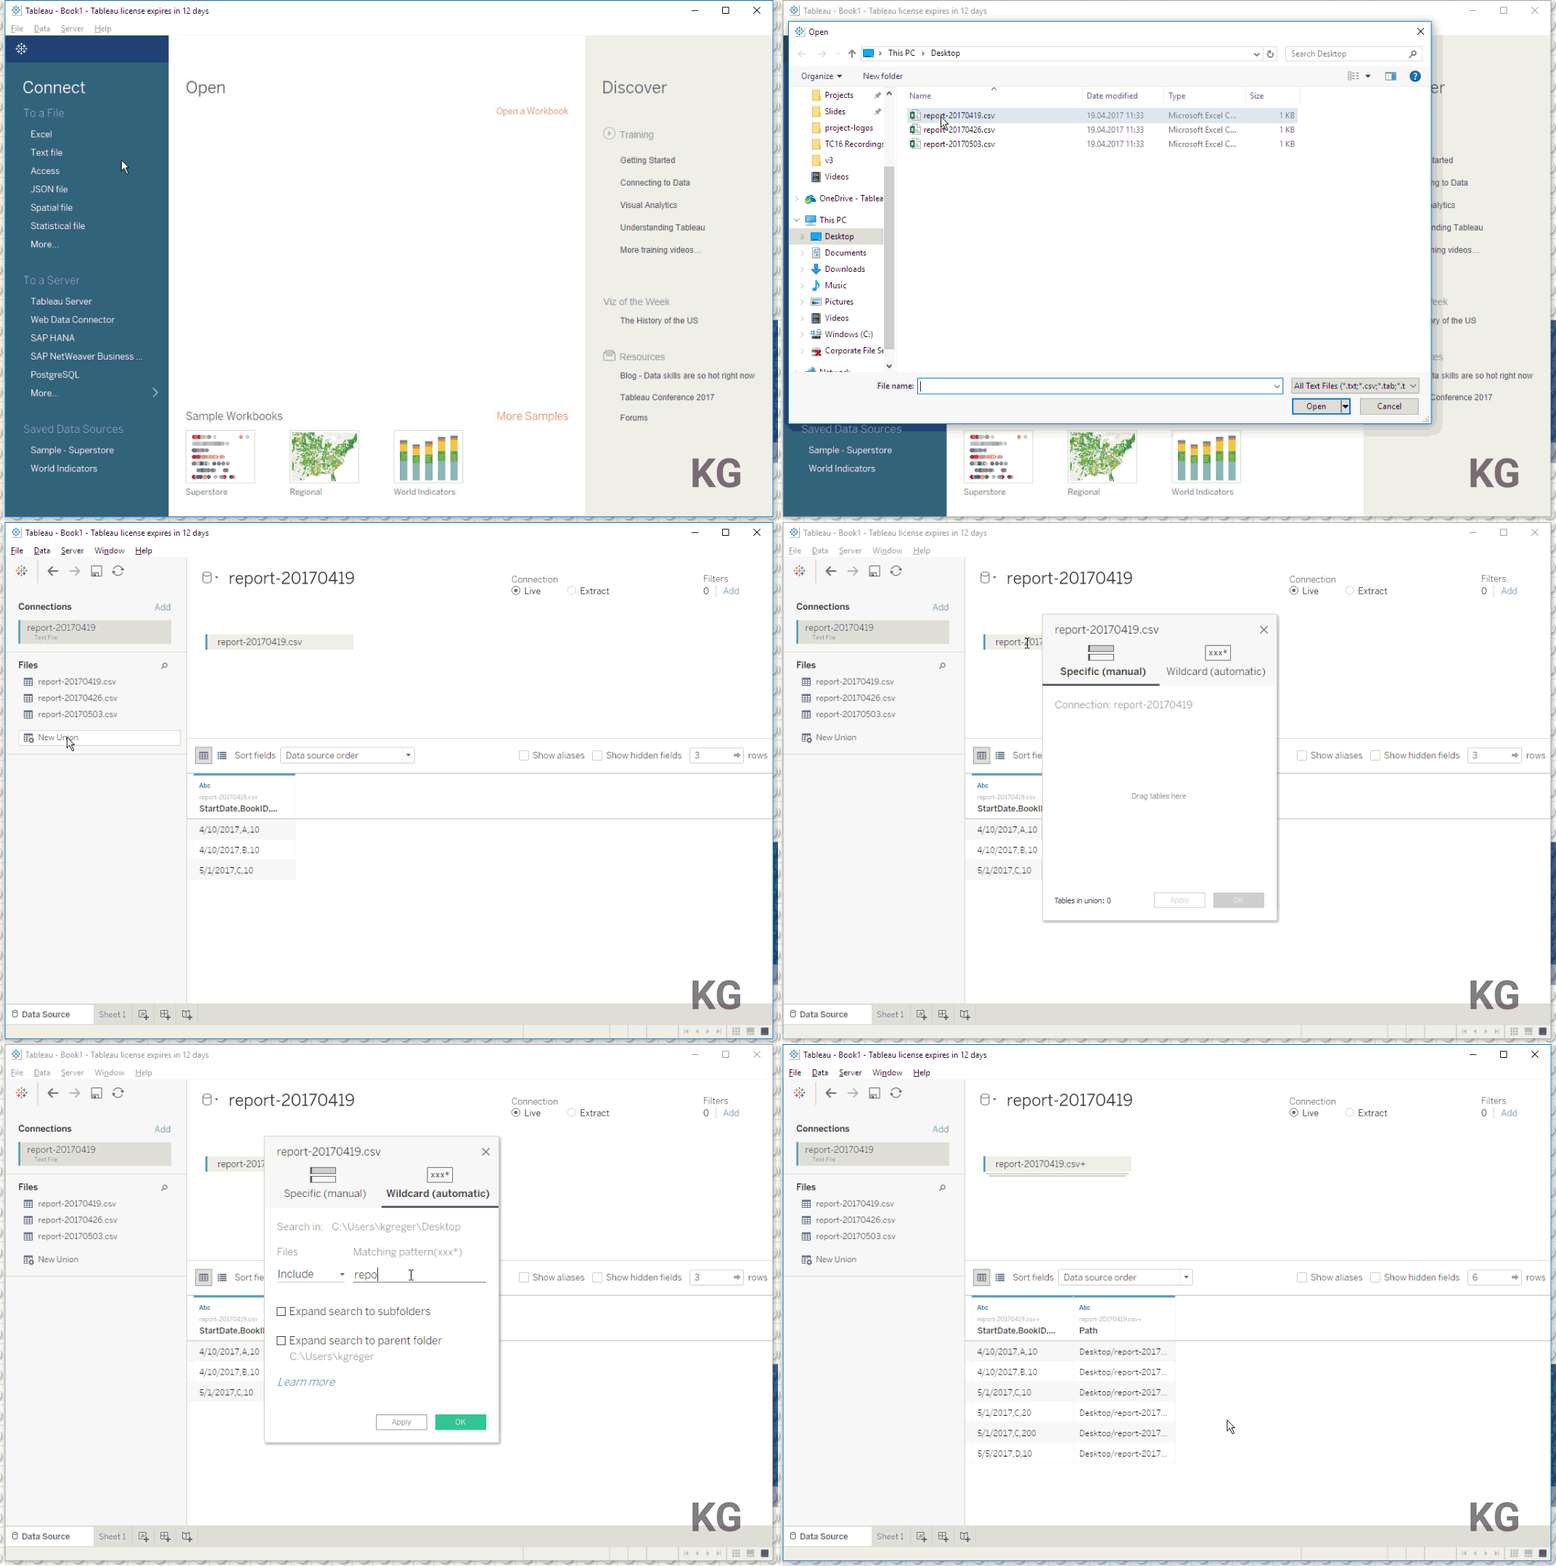
If you have never worked with a wildcard union in Tableau, here’s how it works:
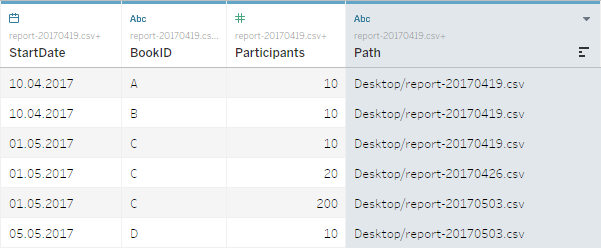
Apart from the fact that Tableau got confused with the comma field separator due to my German system locale this worked quite neatly! This can be fixed by right-clicking the union > Text File Properties… and setting the Locale to English (United States). As you can see Tableau automatically added a new field Path containing the path and filenames of the files that constitute my union. Since I used the pattern report-*.csv all three .csv files in that folder have been picked up. Please note that the union definition dialog also allows you to account for recursively going down a directory tree and even up a folder. Just make sure to define your pattern precisely enough so you don’t pick up unnecessary stuff!
We can then use a nice little regular expression to grab the timestamp we explicitly put into the filenames. In my case it can look something like this:
DATE(DATEPARSE("yyyyMMdd", REGEXP_EXTRACT([Path], ".+?report-(\d{8})\.csv")))
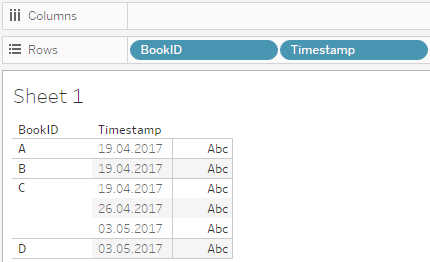
It basically means I’m looking in my field Path for a series of eight digits \d{8} preceded by any number of random characters .+? and the string report-, and then followed by .csv (note the masked .!). The \d{8} is wrapped in parentheses so Tableau’s REGEXP_EXTRACT() function knows what to extract. This is then DATEPARSE()ed into a timestamp and converted to just a date using DATE(). Et voilà, we have a proper date field (I called it Timestamp) in Tableau that holds the information about the report each data point was coming from.

Events have timestamps after extracting the date information from the filenames using regular expressions
Next we define an LOD expression to look for the last timestamp available for each BookID – I called it Last Report:
{ FIXED [BookID]: MAX([Timestamp]) }
This simply evaluates the maximum Timestamp per BookID. If you want to know more about how this works, refer to the second example “Cohort Analysis” in my colleague Bethany Lyons’ great blog post on the Top 15 LOD Expressions.
Now we can just perform a simple check if each of the records is the last one available for this BookID like such:
[Timestamp] == [Last Report]
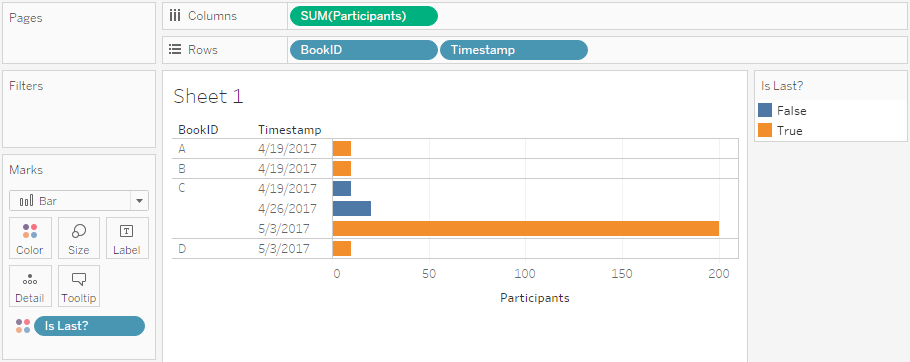
I called the new field Is Last?. Whenever the return type is a Boolean I prefer to add a ? to the field name so I immediately know about its binary nature. The double equal sign is not really necessary, a single one works just as good. It’s just an old habit I have coming from programming languages where = and == mean two very different things and can easily break your code. Luckily Tableau is very understanding of crazy people like me and accepts either way.
Instead of using the new Boolean field to emphasize the last entry per BookID we can now put it on Filter and make sure to show only those where it evaluates as True.
And just like this we have solved our first requirement: Show the current status of participants per event – both for past events (i.e. the actual number of participants) and for future events (i.e. the current number of people registered).
One down, one to go!
Since we still have all the historic data on each BookID at each valid point in time, we can very easily build a viz to show that:

A simple line chart per BookID shows the development of participants enrolled and actually participating
And we’re done! Enjoy trying this on your own data and discovering the power of automatic wildcard unions! You can even play around and test that the wildcard union is working in our demo case by renaming the two latest report files (report-20170426.csv and report-20170503.csv) so they don’t match the pattern anymore (e.g. as --report-20170426.csv), refresh the viz and see what happens. Then revert them step by step back to their original names and see how the viz “grows” over time.


