Population Lines - the Tableau Edition

Population Lines – the Tableau Edition

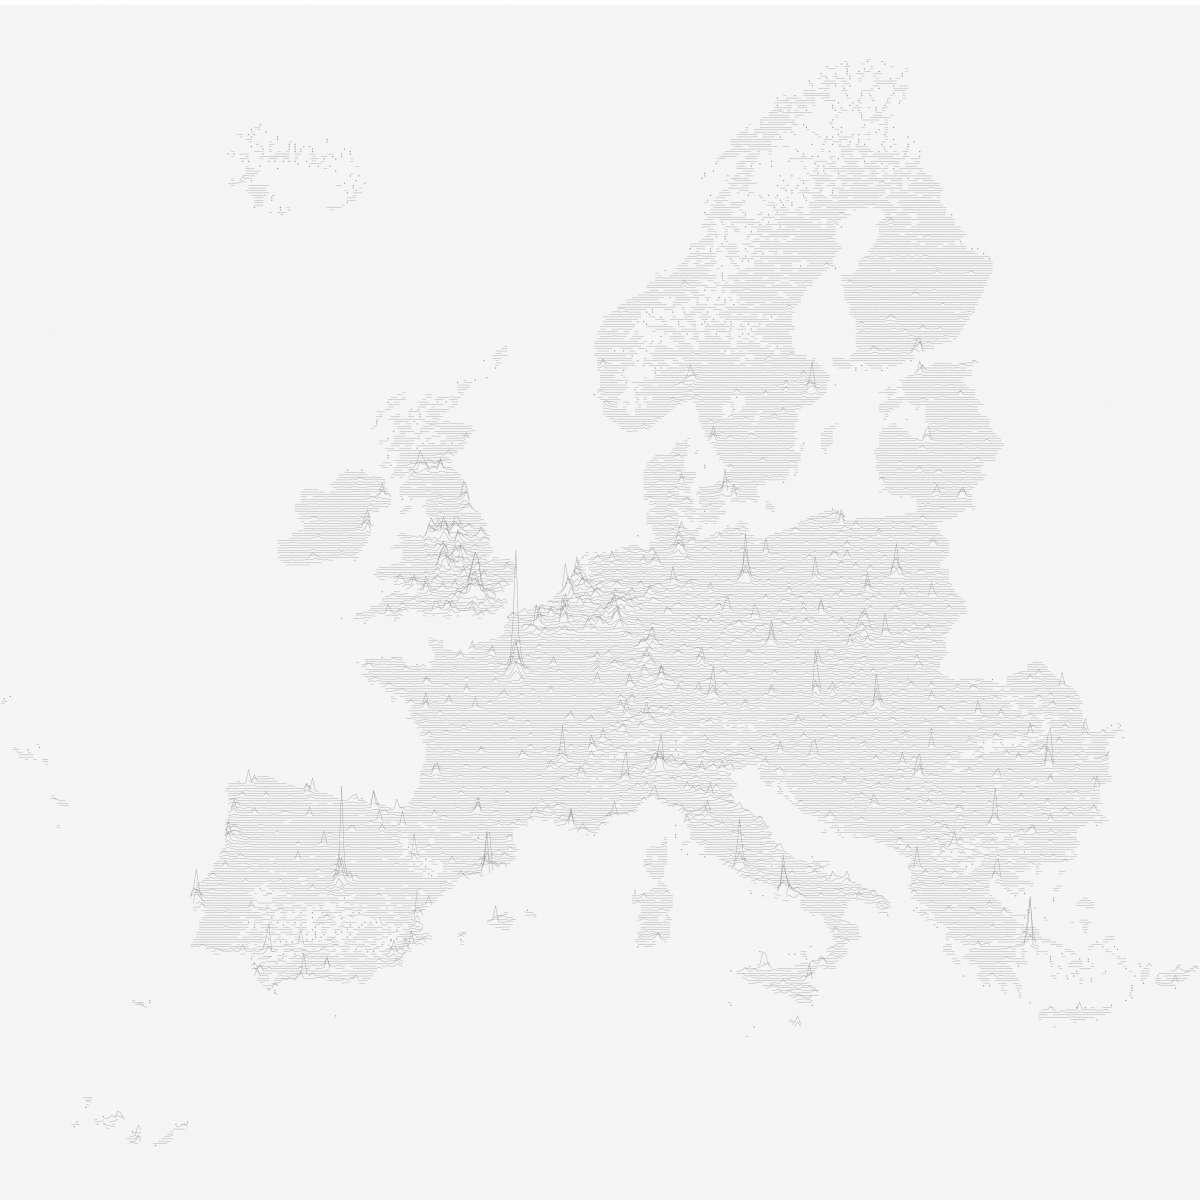
In 2013 Dr. James Cheshire from the Centre for Advanced Spatial Analysis at the University College London created a data visualization that was critically acclaimed back then and saw something of a renaissance a few weeks ago when a modified version by Henrik Lindberg made its way onto the Reddit front page. I had been mesmerized by the viz from the beginning, so when it reappeared in my blog reader I decided I had to try reproducing it in Tableau.

Continue reading →

The last available report per BookID is marked

Reporting Self-Updating Data Using Wildcard Union in Tableau

Imagine you have some kind of system that produces reports on your data – for this example I randomly decided to use bookings for events -, and these reports are published on a regular schedule. Now you want to see two things in your report:

  1. The current status of participants per event – both for past events (i.e. the actual number of participants) and for future events (i.e. the current number of people registered).
  2. An overview of how the number of people registered changed over time.

Also, your source system is publishing these data as .csv files. How can this be done?

Well, very easily using the new wildcard union feature introduced in Tableau Desktop 10.1! Read on to see how this can be done.

Continue reading →