Being a researcher in Japan means I often have to work with Japanese data. While generally data is data is data, there are some peculiarities I came across that seem to be related to the fact that those data are about and produced in Japan.
Firstly there is the way they are delivered. I’m no so much talking about deliveries on “hard media” such as CD-ROMs and DVDs being snail-mailed, even though this seems to be the major way of obtaining data until this day. Luckily I’m embedded in an ecosystem of research institutions and university laboratories that engage in joint research projects and thereby share the necessary datasets online using portal websites. I’d especially like to mention the JoRAS portal of the Center for Spatial Information Science (CSIS) at the University of Tokyo (東京大学) here, since their stock is quite extensive and they are always open for collaboration inquiries.
Secondly there is the fact that, not very surprising, Japanese datasets often contains Japanese data. By this I’m not referring to the fact that this data is dealing with information about Japan, but to the fact that it is making use of Japanese script. This introduces some technical difficulties, which I would like to elucidate in this article.
Japanese Census Data
Recently I received a dataset about the 2010 National Census of Japan on a building block resolution (平成22年国勢調査基本単位区別集計). This is the most granular population distribution dataset available for Japan, which I’m using for my micro-scale estimation of vulnerable populations in urban areas. This is an example of what this data looks like in the raw state I was able to download it in:
D00004C2201010 00101 13101001003080  11-3-42 4 ìåãûìsÅ@êÁë„ìcãÊÅ@Å@Å@Å@Å@Å@Å@Å@Å@Å@ä€ÇÃì‡Å@Å@Å@Å@Å@Å@Å@Å@Å@Å@Å@Å@Å@Å@Å@ÇRíöñ⁄Å@Å@Å@Å@Å@Å@Å@Å@Å@ 01  ,         -,         -,         -,         -
D00004C2201010 00101 13101002001010  11-3- 4 4 ìåãûìsÅ@êÁë„ìcãÊÅ@Å@Å@Å@Å@Å@Å@Å@Å@Å@ëÂéËí¨Å@Å@Å@Å@Å@Å@Å@Å@Å@Å@Å@Å@Å@Å@Å@ÇPíöñ⁄Å@Å@Å@Å@Å@Å@Å@Å@Å@ 01  ,         -,         -,         -,         -
Or at least this is what it looked like when I opened it for the first time in my text editor (TextWrangler on Mac OS X 10.8.1 with English system locale). While TextWrangler (like most modern text editors) offers the option to set the proper encoding for each file, it failed at identifying the correct encoding right away and interpreted the file contents as “Western Mac OS Roman”.

TextWrangler with wrong encoding
The garbled text should read the names of the census tracts in Japanese script. Yet, TextWrangler offers a nifty menu option called “Reopen Using Encoding”, which does exactly what it says. It requires you to know the encoding of your file, though. When it comes to Japanese text encodings there is an irrationally large selection of partly similar yet incompatible encodings to confuse even the most diligent user. From my previous experiences with datasets by Japanese public authorities I took an educated guess of “Shift JIS X0213”, which produced the expected outcome.
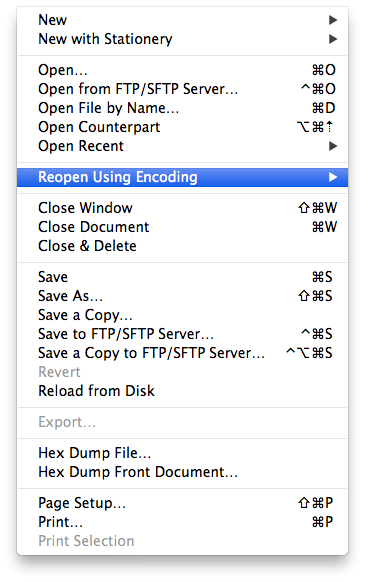
Reopen Using Encoding…

Japanese (Shift JIS X0213)

TextWrangler with correct encoding
Now I was able to read the data and analyze its structure to be able to find out how to make it work in my GIS workflow. The data turned out to use quite a mixed and unintuitive data structure:
- The first part of each line (i.e. dataset) uses fixed width columns, yet with an additional space in between the columns.
- The last four columns, which contain the actual numeric population data, are separated by commata (“,”).
- The first line provides header information for those comma-separated columns, yet not for the former fixed-width columns.
- All the data is provided as strings, even the numeric data:
01 ,0000000027,0000000025,0000000002,0000000027
- Null values for those columns are provided as dashes “-“.
So in addition to the encoding issue I also had to find a way to import this data into a usable table form, such as a proper CSV file, an Excel sheet or an Access database table. The ultimate goal was to be able to import the data into ArcGIS and display it there. This also brought the spatial aspect of this data into my focus. It turned out that the geographic information was provided in a separate file, which looked like this:
H22,13,101,001001110,  11319,01,,35.67815,139.76685,35.67491,139.77008
H22,13,101,001002010,  11334,01,,35.67903,139.76180,35.67579,139.76503
At least there were no encoding issues to be found here, since all the data was numerical. Yet two questions arose:
- Why are there two sets of coordinates provided to each dataset (the last four columns)?
- Why is the building block ID split up into three columns (the second to fourth) while it exists in its concatenated form in the corresponding dataset?
I decided to postpone dealing with the first question until I was able to display the data on a map.
Automation
The second question, together with the need to merge the attributive data from the first file with the spatial data from the second file, and the mixed column separators I mentioned earlier made it obvious to me that this should best be tackled using a Python script. This would also help me in a next step to perform this process on all the datasets I received, one for each of Japan’s 47 prefectures.
Thereby began the struggle to work with non-ANSI encoded data in Python. I’m writing this down here, since it took me quite some time for research on numerous websites to find out how to best deal with encoding-related issues in Python. So in the future I will have these notes as a starting point. Also, I hope to be able to provide consolidated information for fellow developers struggling with these problems. The code I came up with in the end might not be perfect, pretty or high-performance for that matter, but it works for me. Please feel free to comment or correct me where deemed necessary – I’m always open for improvements!
This is the final script I put together:
#!/usr/bin/python
import os
import codecs
import sys
import codecs
import re


## main routine
def main():
  sys.stdout = codecs.getwriter('utf8')(sys.stdout)

  inputfile = codecs.open(u'H22zahyo13.txt','rU','shift_jisx0213')
  lookup = {}
  for line in inputfile:
    line = line.rstrip()
    raw = line.split(",")
    pid = '{}{}{}'.format(raw[1], raw[2], raw[3])   ## PID
    coords = '{},{},{},{}'.format(raw[8], raw[7], raw[10], raw[9])   ## coordinates (X1,Y1,X2,Y2)
    print pid, coords
    lookup[pid] = coords
  inputfile.close()


  inputfile = codecs.open(u'H22KK1T13.TXT','rU','shift_jisx0213')
  outputfile = codecs.open(u'H22KK1T13.CSV','wU','utf-8')

  outputfile.write('"FILEID","F2","PID","BLOCK","F5","A0","A1","A2","A3","F10","POP","POPM","POPF","HH","X1","Y1","X2","Y2"\n')

  for line in inputfile:
    data = []
    data.append('"' + line[:14] + '"')     ## FILEID
    data.append('"' + line[15:20] + '"')   ## F2
    data.append('"' + line[21:35].strip() + '"')   ## PID
    data.append('"' + line[36:44] + '"')   ## BLOCK
    data.append(str(0 if unicode(line[45:46]).strip() in ['', '-'] else int(unicode(line[45:46]).strip())))   ## F5
    data.append('"' + unicode(line[47:51]).strip() + '"')   ## A0
    data.append('"' + unicode(line[51:65]).strip() + '"')   ## A1
    data.append('"' + unicode(line[65:83]).strip() + '"')   ## A2
    data.append('"' + unicode(line[83:96]).strip() + '"')   ## A3
    data.append(str(0 if unicode(line[96:98]).strip() in ['', '-'] else int(unicode(line[96:98]).strip())))   ## F10
    data.append(str(0 if unicode(line[101:111]).strip() in ['', '-'] else int(unicode(line[101:111]).strip())))   ## POP
    data.append(str(0 if unicode(line[112:122]).strip() in ['', '-'] else int(unicode(line[112:122]).strip())))   ## POPM
    data.append(str(0 if unicode(line[123:133]).strip() in ['', '-'] else int(unicode(line[123:133]).strip())))   ## POPF
    data.append(str(0 if unicode(line[134:144]).strip() in ['', '-'] else int(unicode(line[134:144]).strip())))   ## HH
    data.append(lookup[line[21:35].strip()] if line[21:35].strip() in lookup else '0,0,0,0')   ## coords from dict

    output = ','.join(data)
    if line[:1] == 'D': outputfile.write(','.join(data) + '\n')
    print output
  inputfile.close()
  outputfile.close()


## boilerplate startup
if __name__ == '__main__':
    main()
The first issue to I had to deal with was to tell Python the encoding of the input data files. Since I had already identified “Shift JIS X0213” earlier, I used the codecs.open() method to provide the encoding of the file. I also told Python to interpret the filename as UTF-8 encoded further on by preceding the filename with u (unnecessary in this case, but since many of my data paths contain Japanese characters I decided to better be safe than sorry). I also told Python to read the file contents into UTF-8 strings by appending U to the r for read mode, since this was the encoding I was ultimately looking for for my output data:
inputfile = codecs.open(u'H22zahyo13.txt','rU','shift_jisx0213')
I decided to first process the file containing the spatial coordinates, since this would allow me to append them easier to the attributive data contained in the other file. Therefore all I needed from this file was the identifier of the census block (which I called “PID”) and the two coordinate pairs ((X1,Y1),(X2,Y2)).
The former was provided in the second to fourth columns of the comma-separated line, which I stripped of it trailing line break and split by “,”:
line = line.rstrip()
raw = line.split(",")
Since the PID existed in its concatenated 14-character string form in the other file, I had to manually concatenate the PID here:
pid = '{}{}{}'.format(raw[1], raw[2], raw[3]) ## PID
I also decided to reorder the coordinate information given (Y1,X1,Y2,X2) to the format I prefer in my datasets (X1,Y1,X2,Y2):
coords = '{},{},{},{}'.format(raw[8], raw[7], raw[10], raw[9]) ## coordinates (X1,Y1,X2,Y2)
I then put all this data into a Python dictionary, since this is easily the highest performing data structure in Python and can deal with large amounts of data (in this specific case 177,865 entries):
lookup[pid] = coords
This created a structure such as this:
['13101001001010'] = '139.76167,35.68489,139.76491,35.68165'
Please note the fact that the coordinates are concatenated by commata “,”, since this would be the field separator used in the final output file later on.
I then went on to open the other data file the same way I did before. In addition I also created a CSV file for my output data, also providing UTF-8 as the encoding for both the filename and contents:
inputfile = codecs.open(u'H22KK1T13.TXT','rU','shift_jisx0213')
outputfile = codecs.open(u'H22KK1T13.CSV','wU','utf-8')
I then provided proper column headings in the first line of the output file:
outputfile.write('"FILEID","F2","PID","BLOCK","F5","A0","A1","A2","A3","F10","POP","POPM","POPF","HH","X1","Y1","X2","Y2"\n')
While working through every single line of the input file using the for loop I created a Python list (a.k.a. “array”) containing the preprocessed data from the original dataset:
data = []
data.append('"' + line[:14] + '"')     ## FILEID
data.append('"' + line[15:20] + '"')   ## F2
After creating an empty list I start filling it with entries by appending data. This data is coming directly from the current line of the input file, using the Pyhton style “slices”. For example the field “FILEID” contains the first 14 characters, the field “F2” contains five characters from position 15, and so on. I also decided to enclose the string data in double quotes (“””) for easier import to software packages like Microsoft Office and ESRI ArcGIS.
The “PID” is a string of up to 14 characters (starting from position 21), yet in the fixed width column input file is appended by trailing spaces. These can easily be stripped like this:
data.append('"' + line[21:35].strip() + '"') ## PID
Field “F5” represents integer values, which are represented as strings in the input file. Therefore I needed to manually take care of the conversion. The if statement catches those exceptions where null values were represented by empty strings or dashes “-” in the input data. Trying to convert these using the int() function would otherwise cause an error message:
data.append(str(0 if unicode(line[45:46]).strip() in ['', '-'] else int(unicode(line[45:46]).strip()))) ## F5
It is worth noting here how I had to regard the input data as unicode strings, since some of the trailing spaces were not simple spaces but unicode whitespaces (such as Ux0500), that needed to be removed using the .strip() function. Regular (i.e. non-unicode strings) also have a .strip() function, yet this will not remove those unicode whitespaces.
The same is true for fields “F10”, “POP”, “POPM”, “POPF” and “HH”, where the latter contain the actual demographic data (population total, male, female, number of households).
data.append(str(0 if unicode(line[96:98]).strip() in ['', '-'] else int(unicode(line[96:98]).strip())))   ## F10
data.append(str(0 if unicode(line[101:111]).strip() in ['', '-'] else int(unicode(line[101:111]).strip())))   ## POP
data.append(str(0 if unicode(line[112:122]).strip() in ['', '-'] else int(unicode(line[112:122]).strip())))   ## POPM
data.append(str(0 if unicode(line[123:133]).strip() in ['', '-'] else int(unicode(line[123:133]).strip())))   ## POPF
data.append(str(0 if unicode(line[134:144]).strip() in ['', '-'] else int(unicode(line[134:144]).strip())))   ## HH
Fields “A0” to “A3” contains the Japanese names of the census blocks, therefore I had to take special care of the correct handling of the unicode contents by creating unicode string variables and using the unicode .strip() function once again:
data.append('"' + unicode(line[47:51]).strip() + '"')   ## A0
data.append('"' + unicode(line[51:65]).strip() + '"')   ## A1
data.append('"' + unicode(line[65:83]).strip() + '"')   ## A2
data.append('"' + unicode(line[83:96]).strip() + '"')   ## A3
Lastly I appended the coordinates which originated from the file I processed earlier:
data.append(lookup[line[21:35].strip()] if line[21:35].strip() in lookup else '0,0,0,0') ## coords from dict
The data is read from the Python dict I created earlier using the “PID” as identifier. Since the returned string contains no unicode information, no special handling was necessary. I only had to catch those cases where no coordinates were provided (such as for aggregate regions), where I had to manually provide “empty” coordinates (0,0,0,0) using an if statement.
Lastly I concatenated all elements of the Python list using .join() and commata (“,”) as field separators.
output = ','.join(data)
Since I included my own proper first line due to the useless character of the original header line, I needed to make sure not to write it to the output file. I did this by identifying the correct lines by their first character “D”.
if line[:1] == 'D': outputfile.write(','.join(data) + '\n')
Outcome
This short script allowed me to quickly convert the data into a format I could use in my actual processing software. Personally I imported it into a Microsoft Access database and imported it from there into an ArcGIS file geodatabase (FGDB) to create maps such as this:
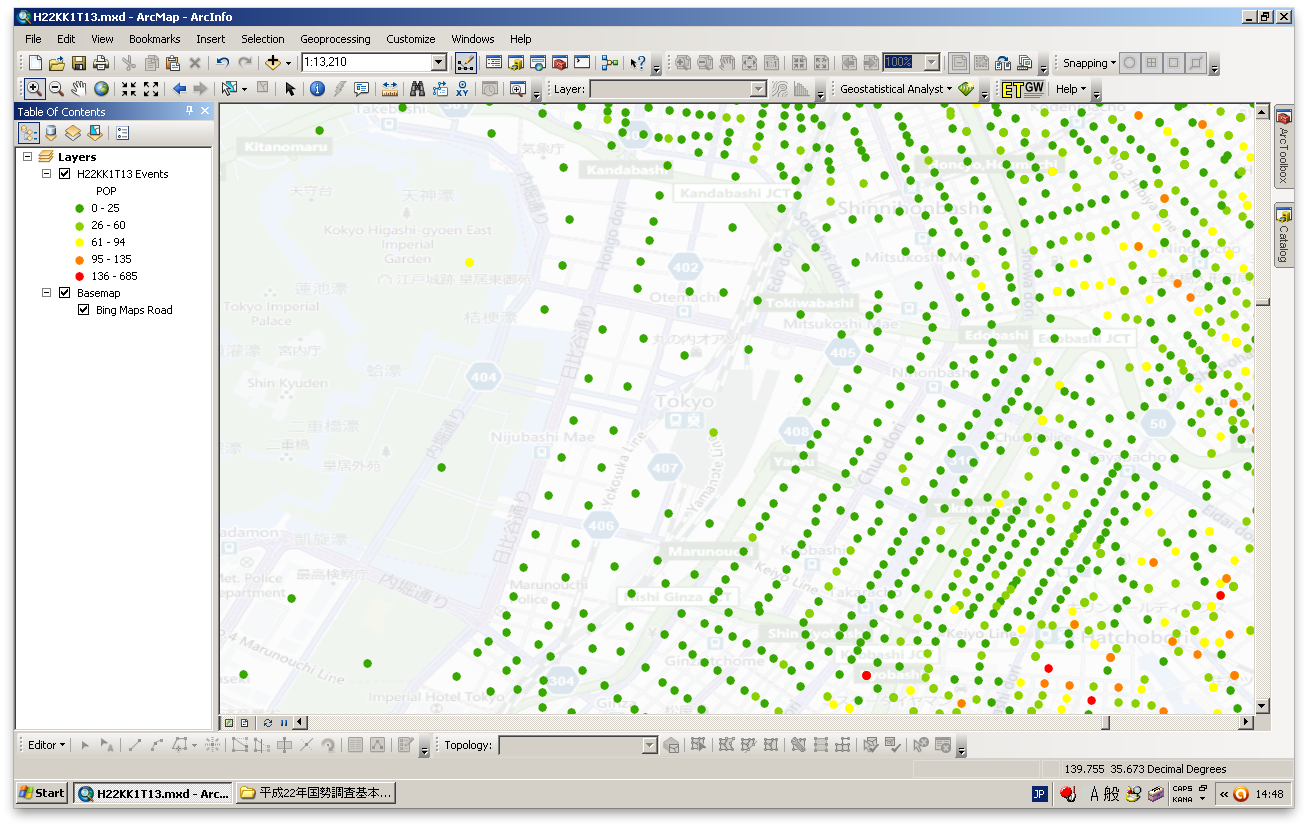
Data mapped successfully in ArcGIS 10
(Data copyright by Statistical Information Institute for Consulting and Analysis (Sinfonica, 公益財団法人統計情報研究開発センター). Background map provided by Microsoft Bing Maps.)
Some testing revealed that this script runs smoothly only on Python 3.x. It can be tweaked to run on Python 2.6 and newer, though, by providing the format placeholder IDs on lines 18 and 19 like this:
pid = '{0}{1}{2}'.format(raw[1], raw[2], raw[3])   ## PID
coords = '{0},{1},{2},{3}'.format(raw[8], raw[7], raw[10], raw[9])   ## coordinates (X1,Y1,X2,Y2)