I had been planning to write this post for a long time. Not only have I been asked many times how to do this in my daily consulting work, but especially during and after my hands-on training “Stretching the Boundaries with Advanced Mapping” at our Tableau Conference On Tour 2017 in Berlin earlier this year. The question is pretty simple: How can I draw paths in Tableau? Oftentimes these are some kind of movement data, e.g. refugees or flight connections. The way to do this in Tableau is actually very easy – and some of the recently introduced features made it even easier – but it’s imperative to understand how Tableau draws lines and how the data therefore needs to be structured.
Category / Good to Know
Using Coordinate Data in Degrees (DMS) Format in Tableau
Have you ever received a spatial data set that you wanted to visualize in Tableau, only to find out the coordinates looked like this: 50°07'01.9"N 8°40'20.8"E
If so, or if you’re just generally interested in geographic data and Tableau, this post is for you.
LEGO-ify Tableau
A number of colleagues, customers, people visiting any of my public presentations and even friends have asked in the recent past about my Windows desktop wallpaper and where to get it.
The first question I get most of the time is: “Is it real?” Well, no. Unfortunately it’s not. I’d love to have enough time to build something that awesome in real LEGO bricks, though!
So, if it’s not real, then how was it done? As is often the case with me I got the inspiration from one of the many blogs I read on a regular basis. In this case it was an article by John Nelson over on his blog Adventures in Mapping. There he showed an easy-to-follow way to LEGO-ify maps and satellite images. And I did exactly the same, just with an image of the lovely Tableau logo (Tableaugo? … maybe not) after scaling it to a Full HD resolution of 1920 x 1080 pixels and filling the empty space with white bricks pixels. Credit where credit is due, so I won’t nastily copy & paste the how-to here but instead redirect you to John’s writings. In the meantime John and Vanni Zhang, another map and LEGO geek, even whipped up an interactive website that allows you to automagically generate LEGO-ified maps from web maps.
Give it a try, enjoy the LEGO style and take care not to break any virtual fingernails with those pesky 1×1 bricks… Also, show us what LEGO-goodness you came up with! Oh, and feel free to download my TabLEGau wallpaper. When sharing I’d be happy if you told people where you got it from.
Reporting Self-Updating Data Using Wildcard Union in Tableau
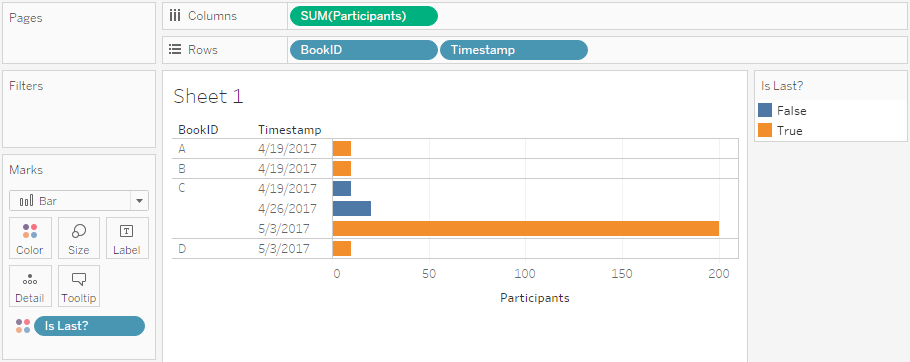
Imagine you have some kind of system that produces reports on your data – for this example I randomly decided to use bookings for events -, and these reports are published on a regular schedule. Now you want to see two things in your report:
- The current status of participants per event – both for past events (i.e. the actual number of participants) and for future events (i.e. the current number of people registered).
- An overview of how the number of people registered changed over time.
Also, your source system is publishing these data as .csv
files. How can this be done?
Well, very easily using the new wildcard union feature introduced in Tableau Desktop 10.1! Read on to see how this can be done.
Run code from an external .R file in Tableau
Tableau introduced the R
integration in version 8.1 back in 2013. That’s awesome because it opens up to Tableau the whole range of analytical functionality R
offers. Most of the time the R code being triggered from within Tableau is rather short, such as a regression, a call to a clustering algorithm or correlation measures. But what happens when the code you want to run out of Tableau is getting longer and more complicated? Are you still bound to the “Calculated Field” dialog window in Tableau? It’s nice but it’s tiny and has no syntax coloring or code completion for our precious R
code.