In the last quarter of 2016 the German marketing team came up with a great way to follow the immense success of last year’s Tableau Stadium Tour: the Tableau Cinema Tour! After visiting ten cities all over Germany, Austria, and Switzerland, we are now considering rolling it out all over Europe. Stay tuned for that! Since we often got requests for the data used in the main demo, I decided to produce this write-up of how to extract the data from the Internet Movie Database (IMDb). Unfortunately copyright reasons make it impossible for us to just provide you the ready-made data. That said, with this walk-through everybody should be able to get the data!
Category / Visual Data Analysis
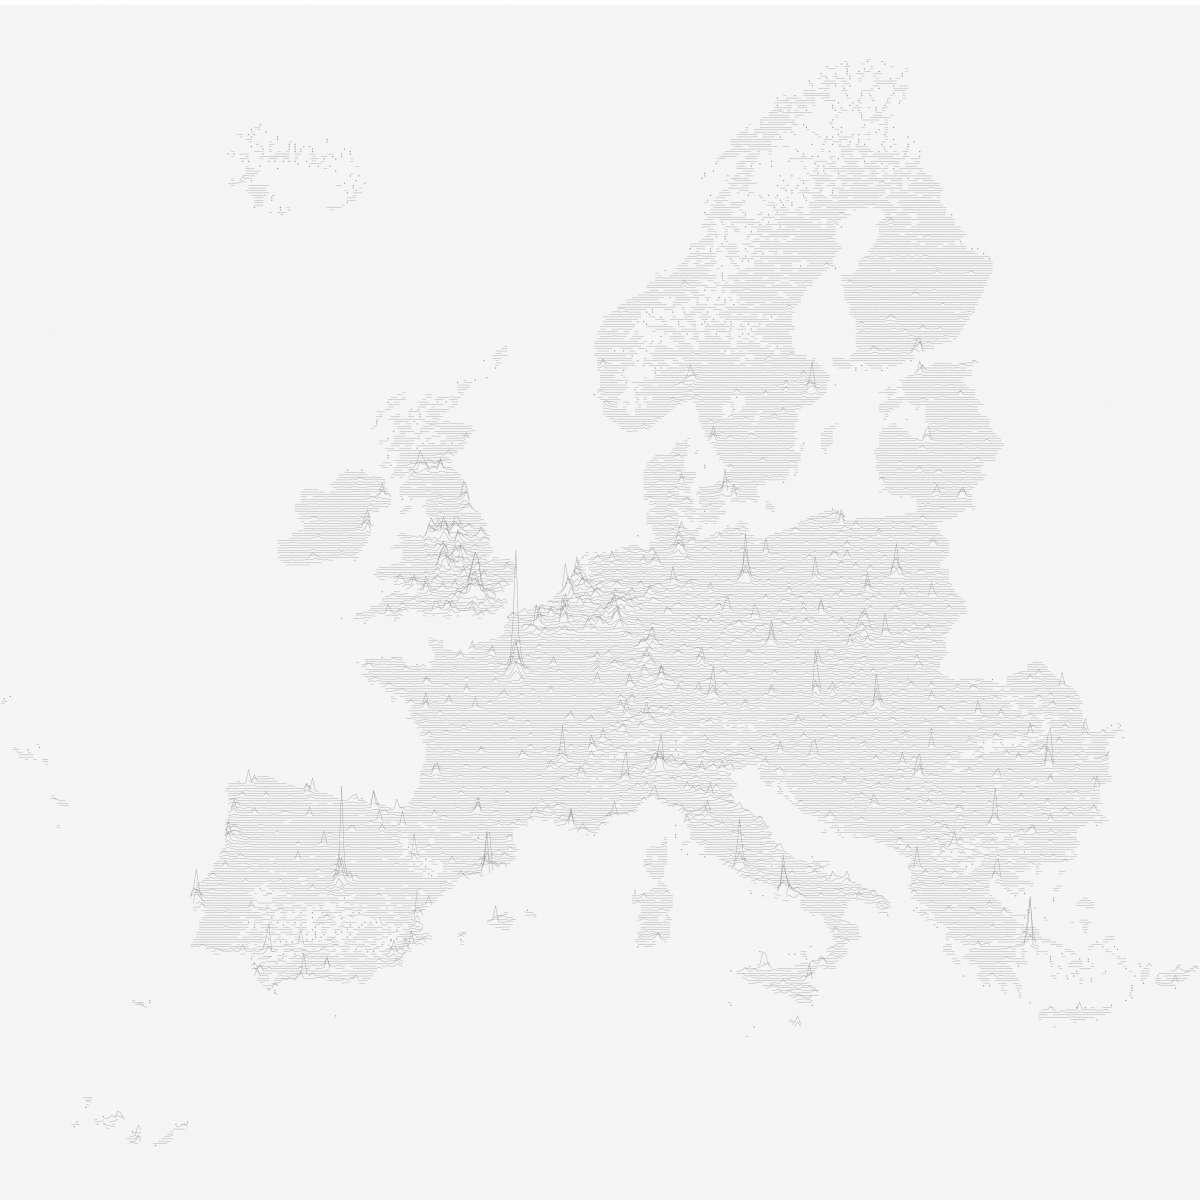
Population Lines – the Tableau Edition
In 2013 Dr. James Cheshire from the Centre for Advanced Spatial Analysis at the University College London created a data visualization that was critically acclaimed back then and saw something of a renaissance a few weeks ago when a modified version by Henrik Lindberg made its way onto the Reddit front page. I had been mesmerized by the viz from the beginning, so when it reappeared in my blog reader I decided I had to try reproducing it in Tableau.
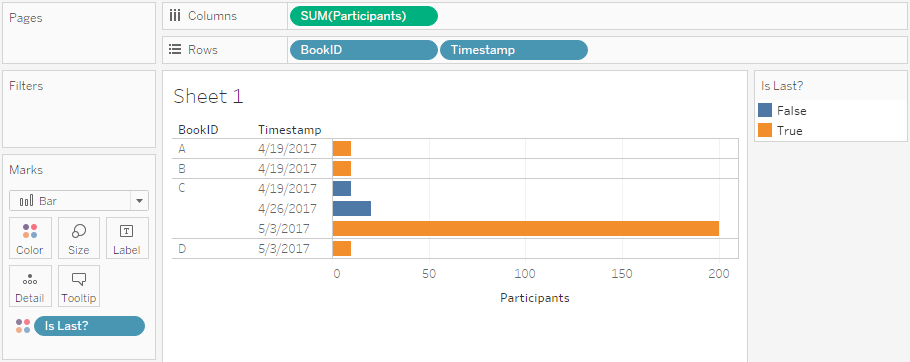
Reporting Self-Updating Data Using Wildcard Union in Tableau
Imagine you have some kind of system that produces reports on your data – for this example I randomly decided to use bookings for events -, and these reports are published on a regular schedule. Now you want to see two things in your report:
- The current status of participants per event – both for past events (i.e. the actual number of participants) and for future events (i.e. the current number of people registered).
- An overview of how the number of people registered changed over time.
Also, your source system is publishing these data as .csv files. How can this be done?
Well, very easily using the new wildcard union feature introduced in Tableau Desktop 10.1! Read on to see how this can be done.

Hinter den Kulissen der Tableau Kino Tour – Teil 3: Die Tatorte
Nachdem ich in den beiden vergangenen Teilen dieser Serie gezeigt hatte, wie wir die IMDb-Daten (Teil 1) bzw. die Daten zu Filmreihen (Teil 2) extrahiert und in ein brauchbares Format überführt haben, möchte ich nun noch beleuchten, wie wir die Daten zur Analyse der Krimireihe “Tatort” gewonnen und bearbeitet haben. Für den “Tatort” als Untersuchungsobjekt haben wir uns entschieden, da es dazu Unmengen an Daten gibt (s.u.), da sich die Serie von verschiedenen Aspekten her analysieren lässt (die Serie wird seit vielen Jahrzehnten produziert, findet an unterschiedlichen geographischen Orten statt, involviert eine Menge an Ermittlern, Schauspielern, usw.), und da es eine der, wenn nicht sogar die beliebteste deutsche Fernsehserie ist. Und auch, weil ich selbst ein großer Fan bin und mich das Thema und die Daten auch ganz persönlich interessiert haben…

Run code from an external .R file in Tableau
Tableau introduced the R integration in version 8.1 back in 2013. That’s awesome because it opens up to Tableau the whole range of analytical functionality R offers. Most of the time the R code being triggered from within Tableau is rather short, such as a regression, a call to a clustering algorithm or correlation measures. But what happens when the code you want to run out of Tableau is getting longer and more complicated? Are you still bound to the “Calculated Field” dialog window in Tableau? It’s nice but it’s tiny and has no syntax coloring or code completion for our precious R code.

Run R code inline in a Calculated Field in Tableau